In my previous exploration of playing cards, I spent some time looking at the small design variations between different decks. It turns out that once you start paying attention to these things, it's impossible to stop.
Which brings me to my next question: just how different are these cards from one another?
Looking at two cards side by side is one way to compare them, but I wanted to take things a little further. Could I actually measure how similar or different two playing card illustrations are?
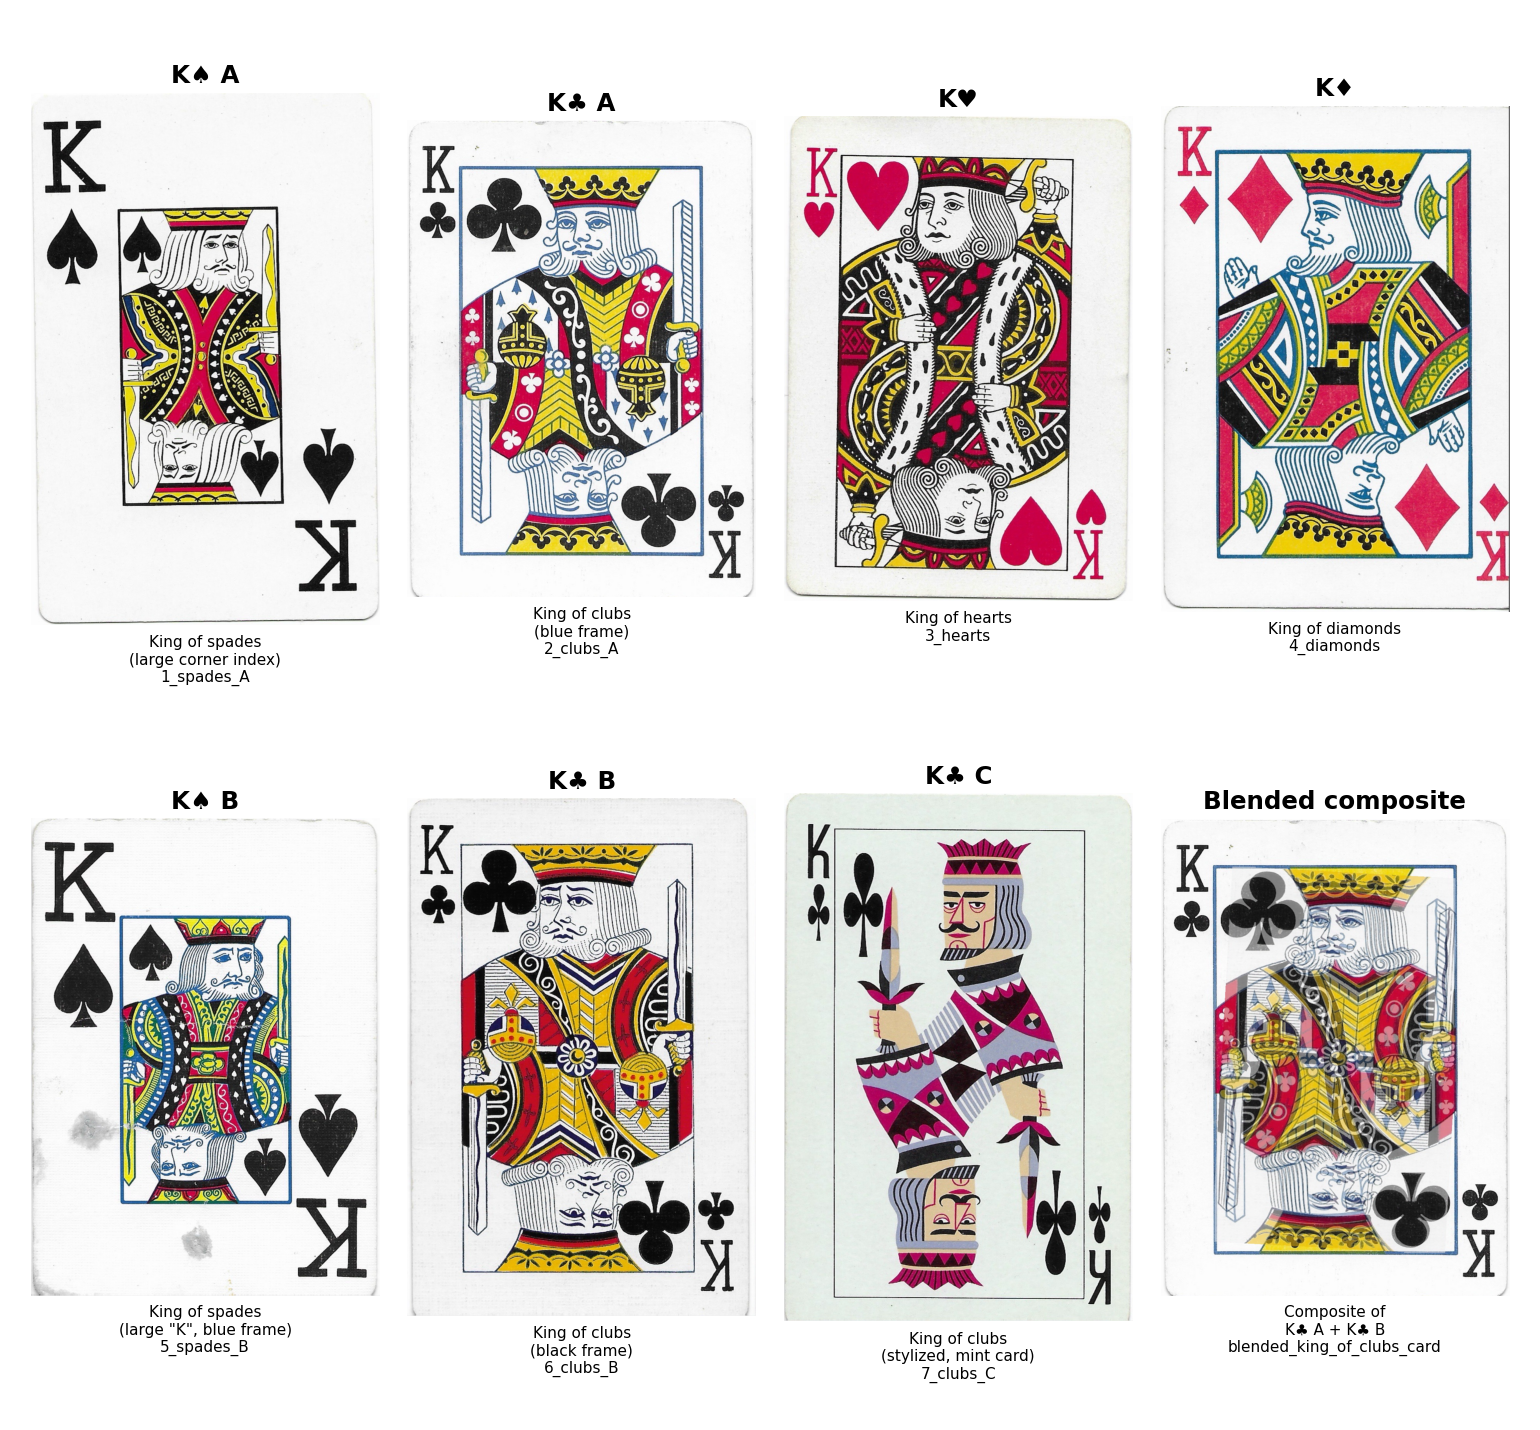
First I designated a subset of cards for investigation. The original king cards in my exploration:
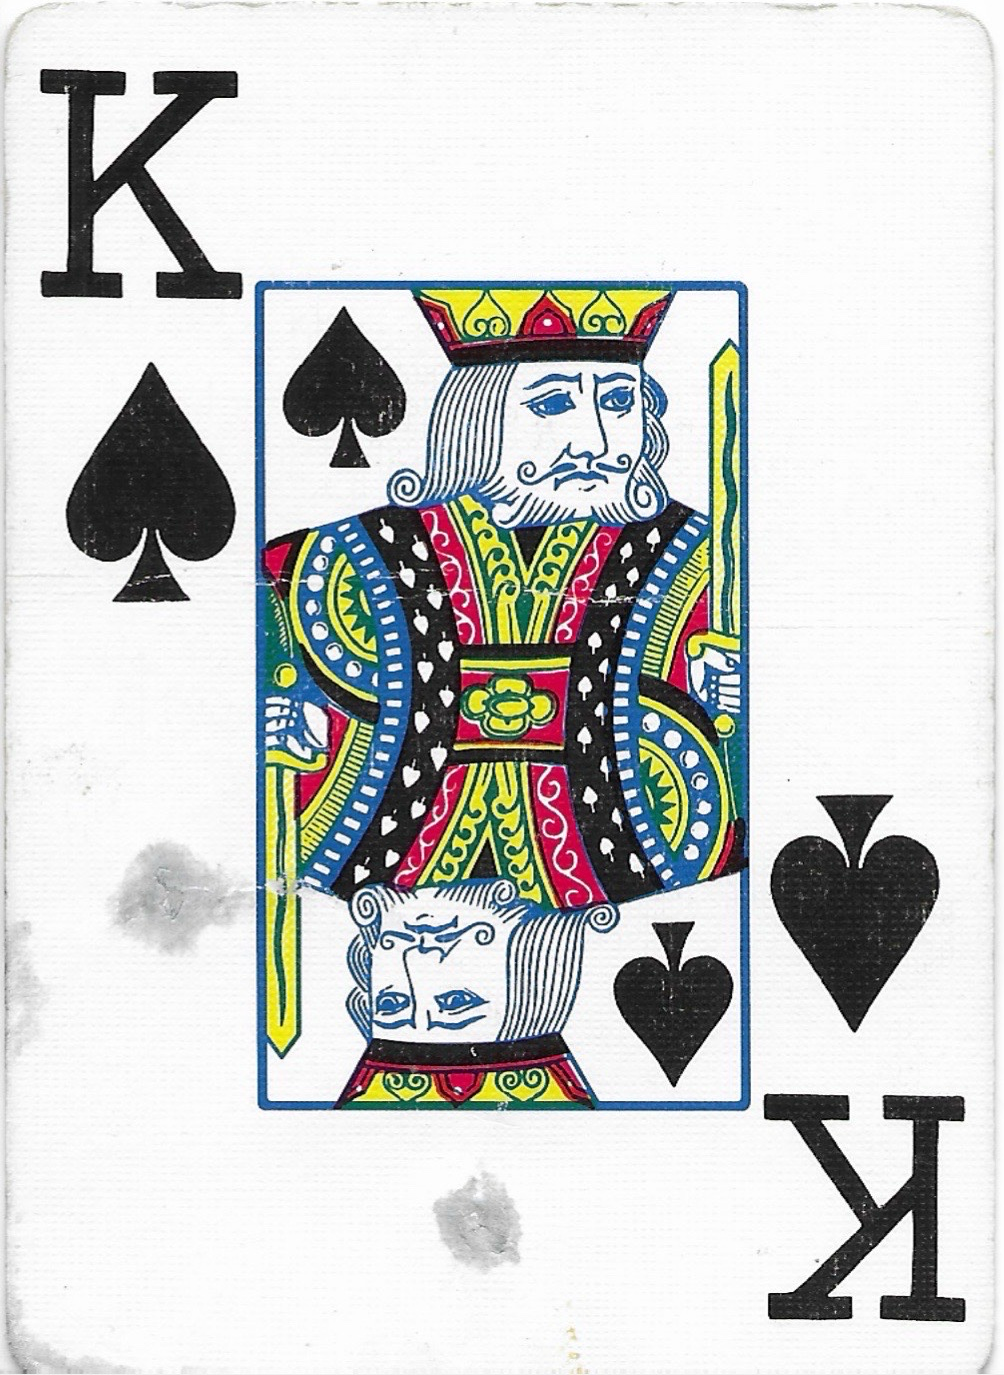
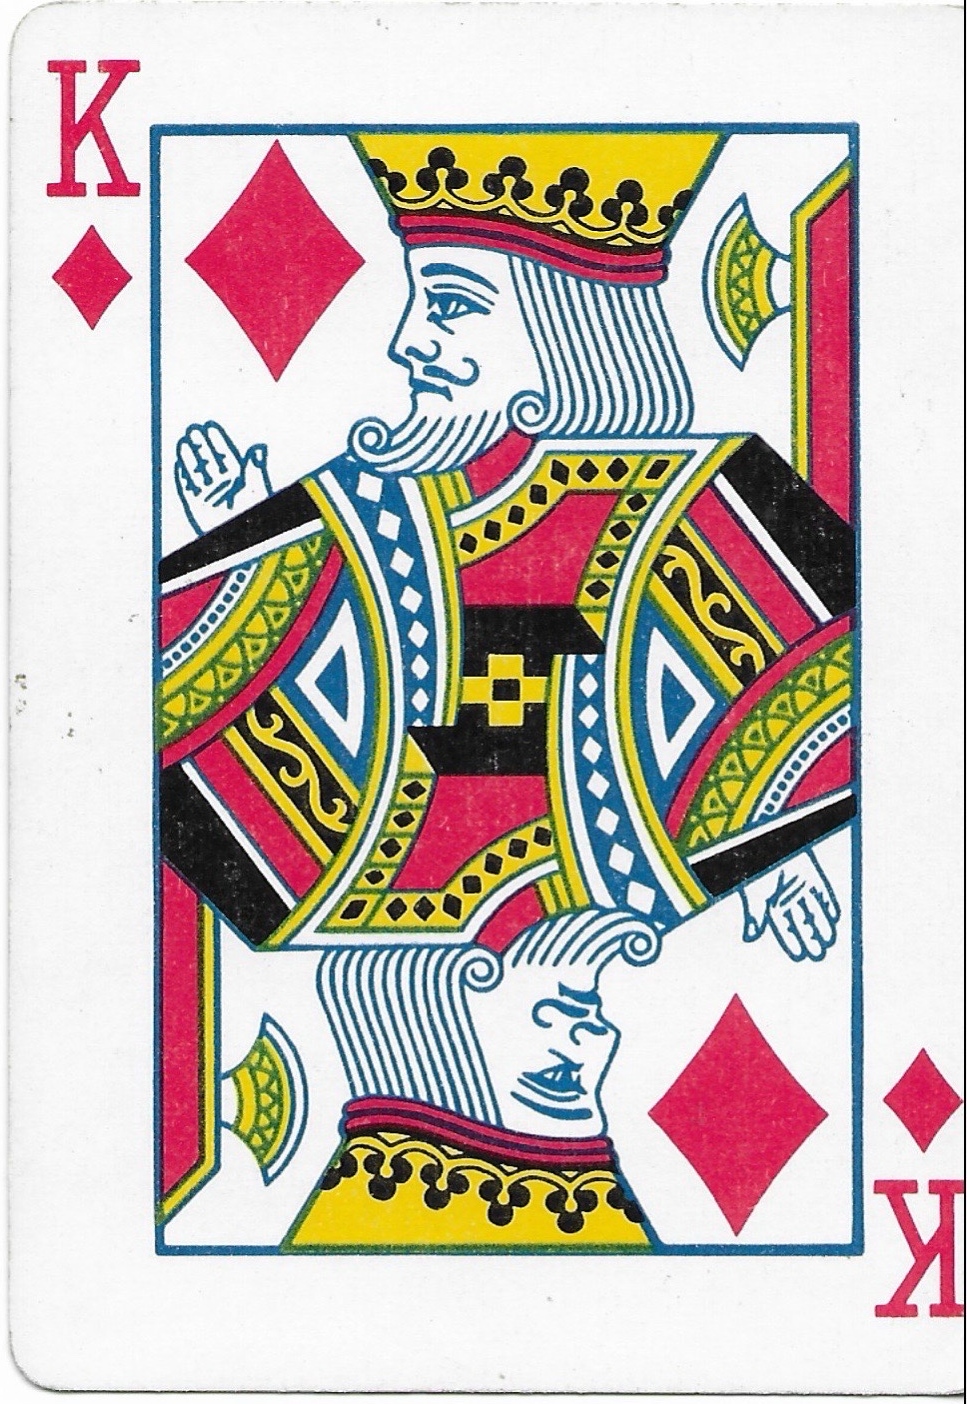
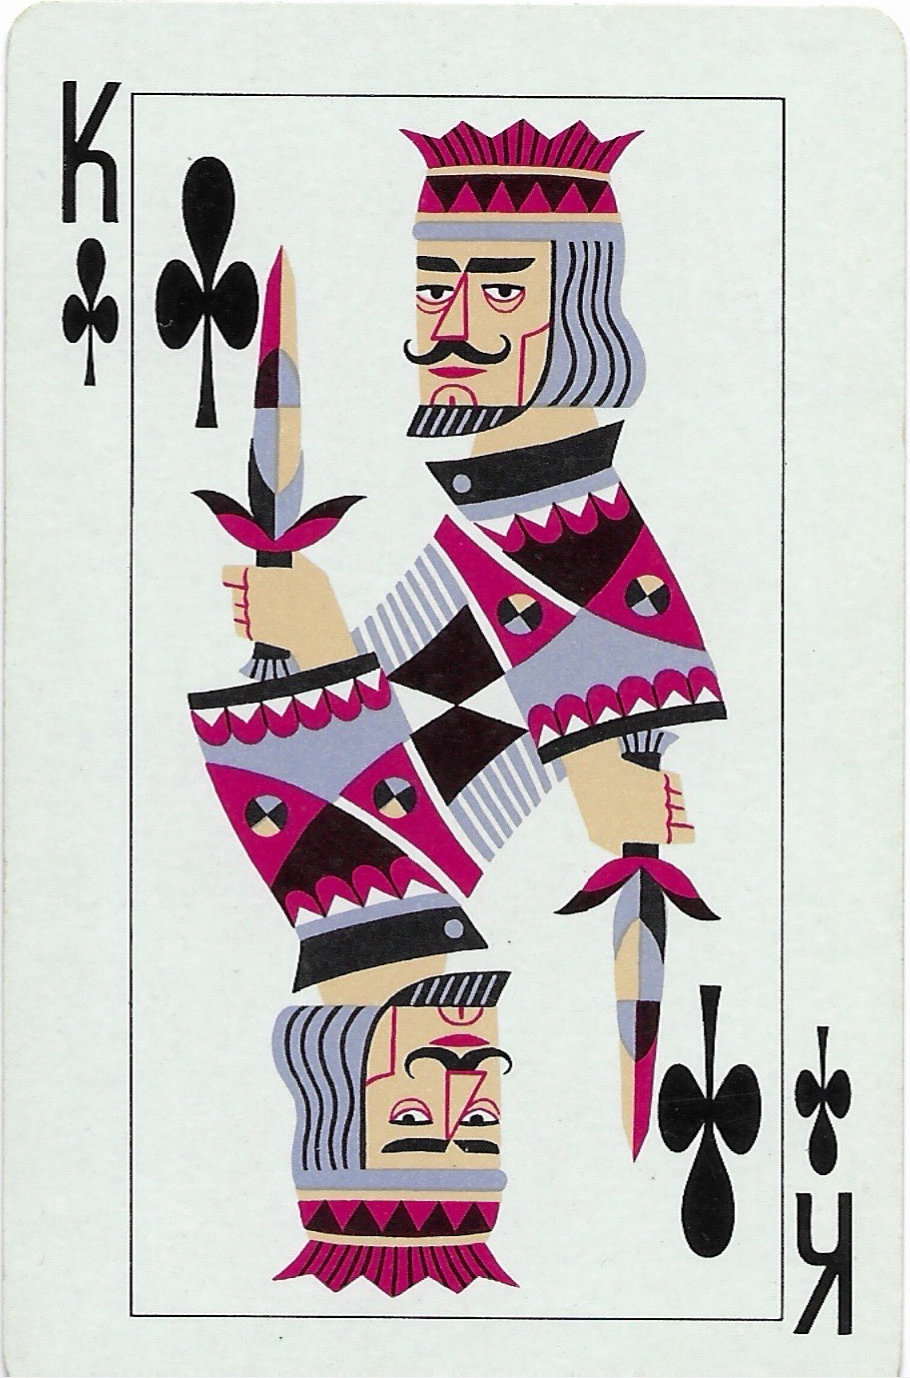
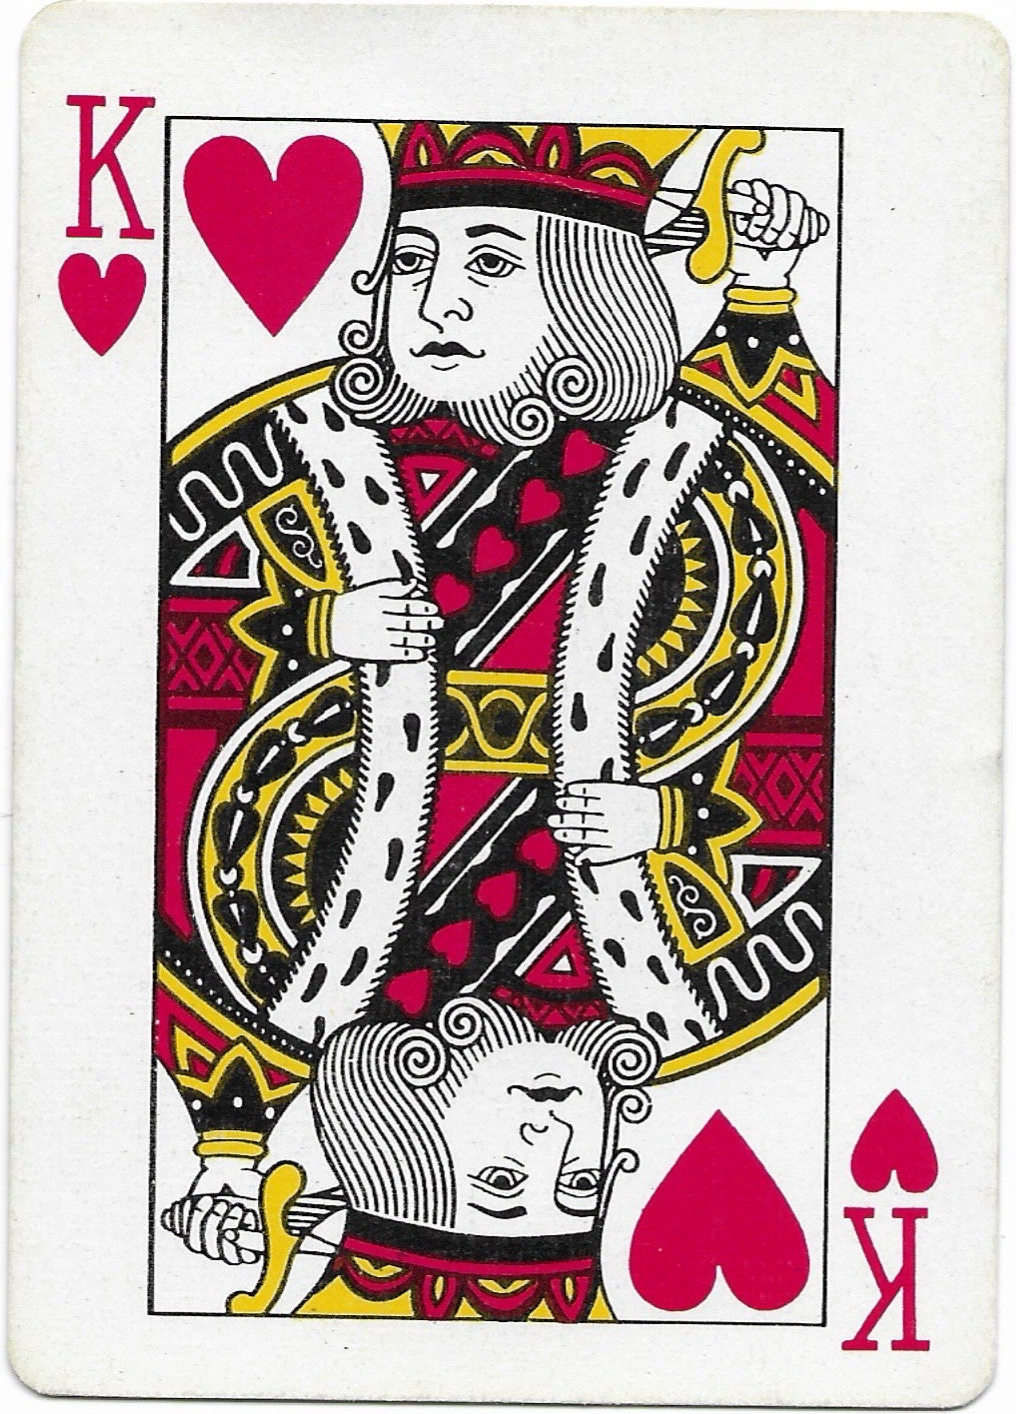
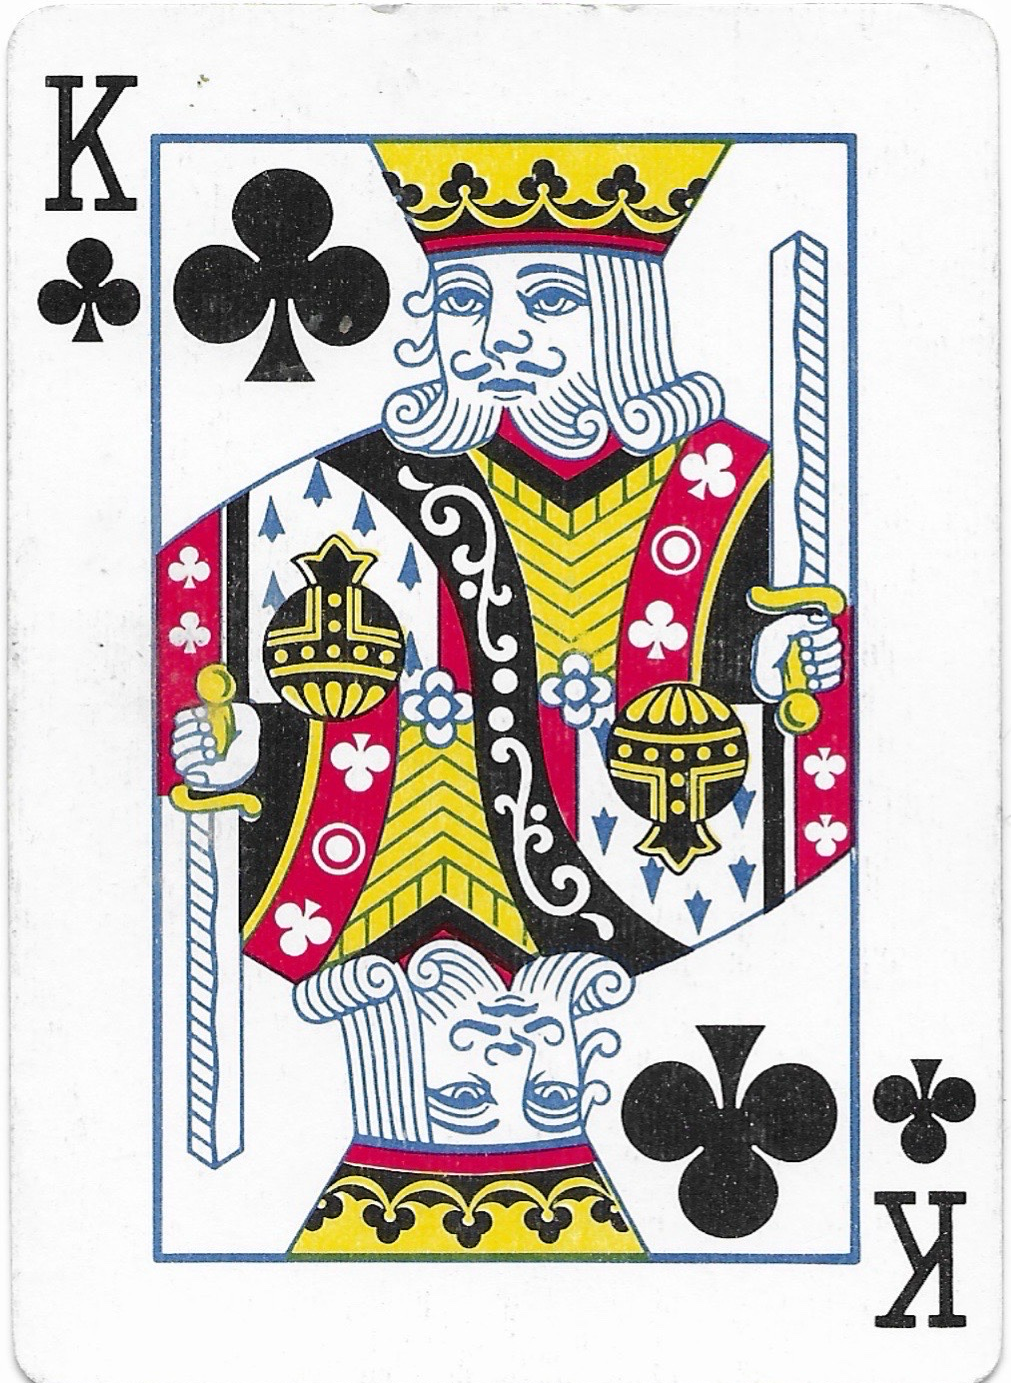
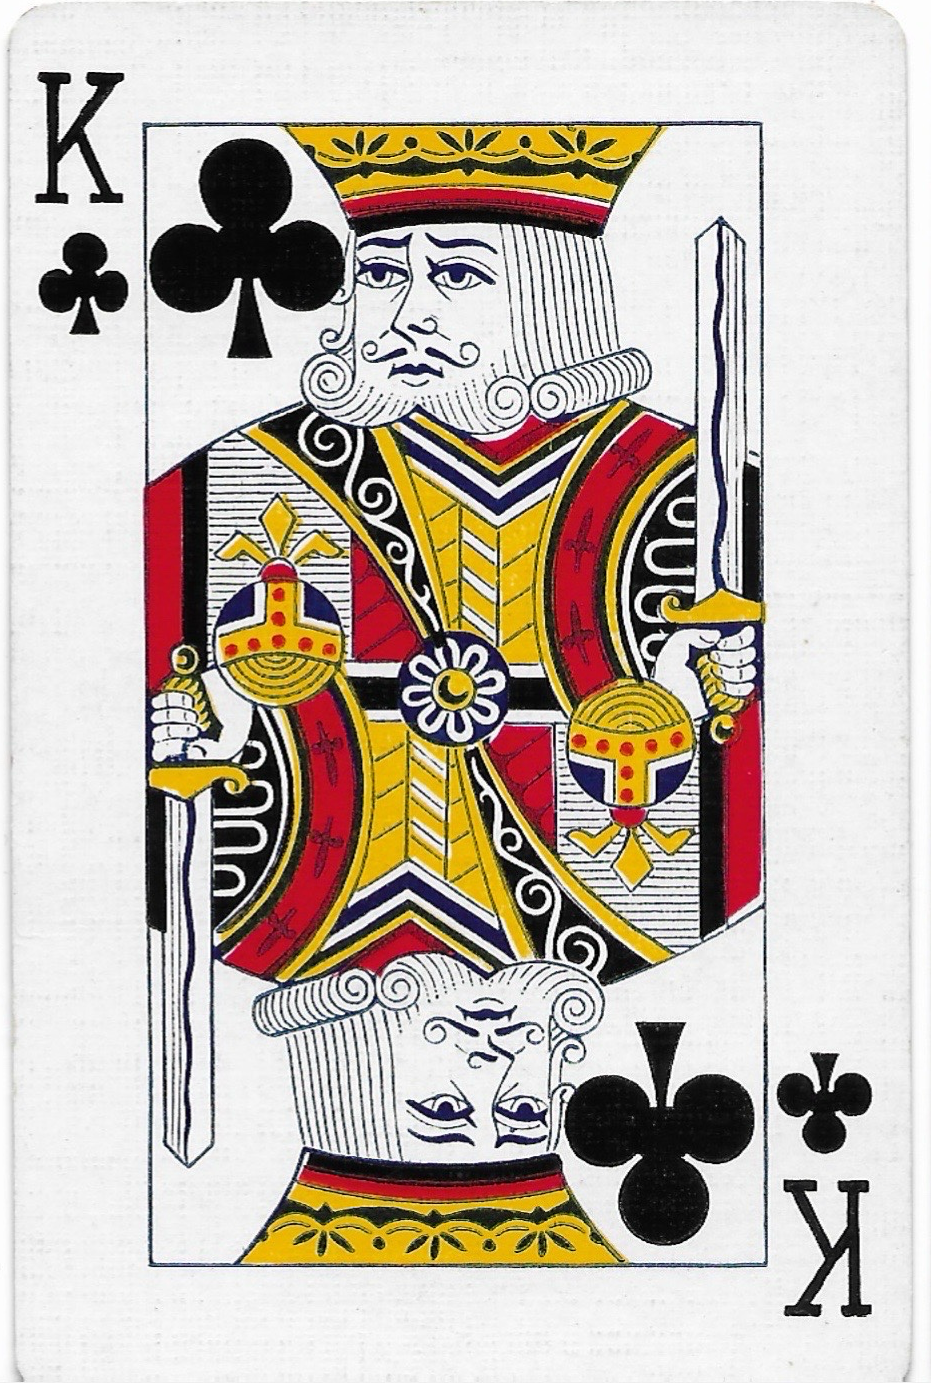
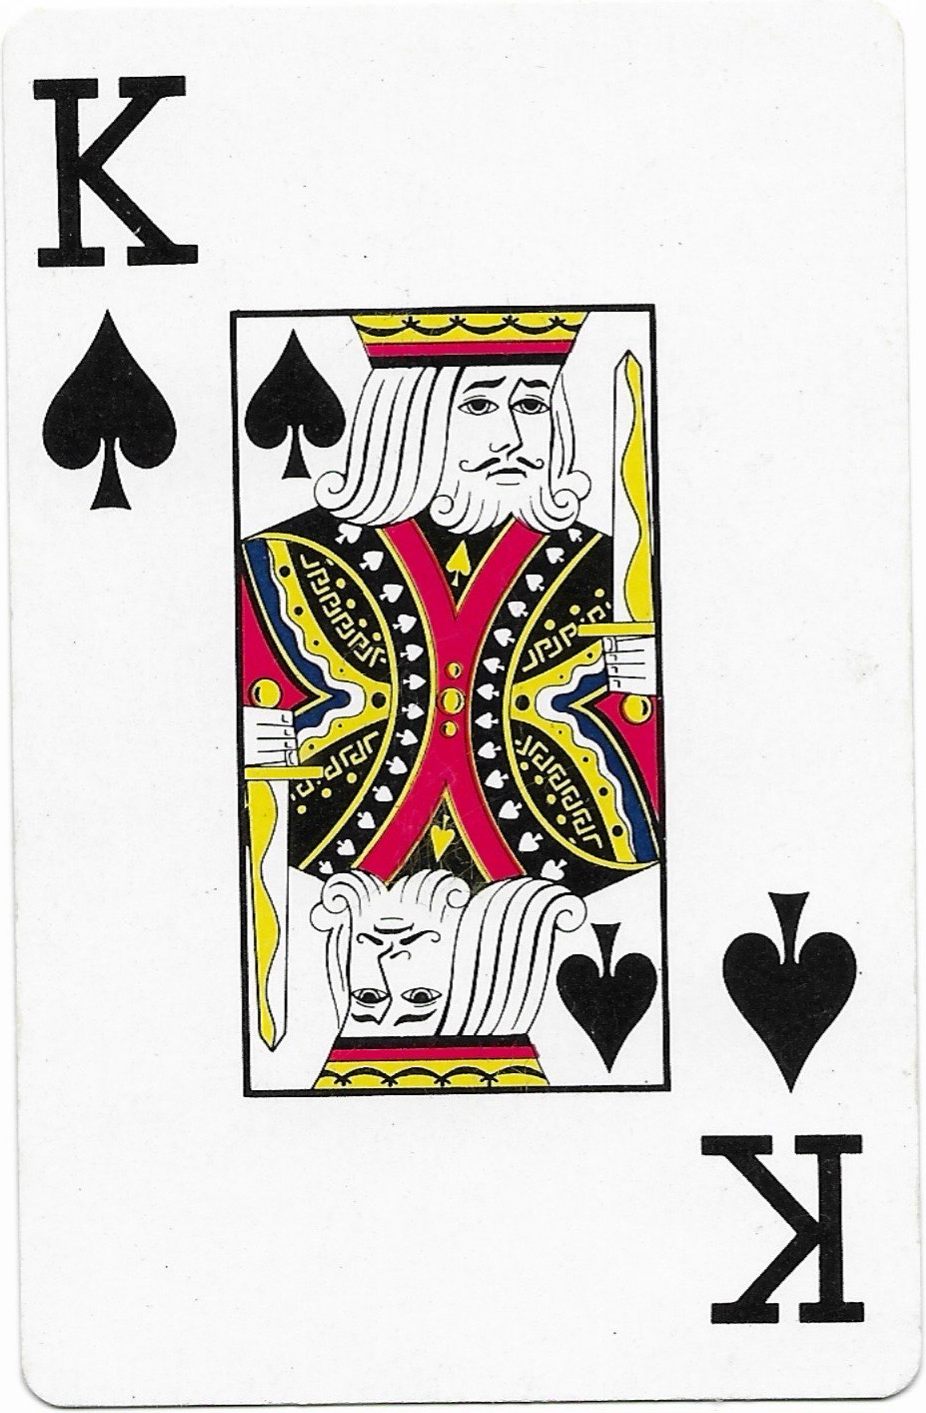
And then I threw AI at it!
This, of course, was not the best approach bit it is worth noting to help us understand what it actually means to determine how different two images are and how those differences are conceptualized and operationalized.
Claude suggested 4 possible approaches to the problem:
Pixel-by-pixel difference (percent changed)
Works best when the images are the same size and roughly aligned.SIM (Structural Similarity Index)
This is closer to how humans perceive similarity. It scores from 0 to 1 (1 = identical) and also produces a map showing where the differences are.Perceptual hashing
Good for finding near-duplicates, even if they’ve been resized or lightly edited. Not the most ideal for us since the images are not that similar.Feature or embedding comparison
If you care about content similarity (two different photos of the same dog) rather than pixel changes, neural network embeddings (like CLIP) compare meaning rather than pixels. This one also doesn’t really fit with our stimuli.
Based on the process of eliminating the methods that wouldn’t make sense for our cards I settled on trying approaches 1 and 2.
This means that there is a comparison for each pair of cards. With 7 cards that’s 21 pairs, and for each one Claude calculated the percent of pixels that differ between the cards and an SSIM similarity score.
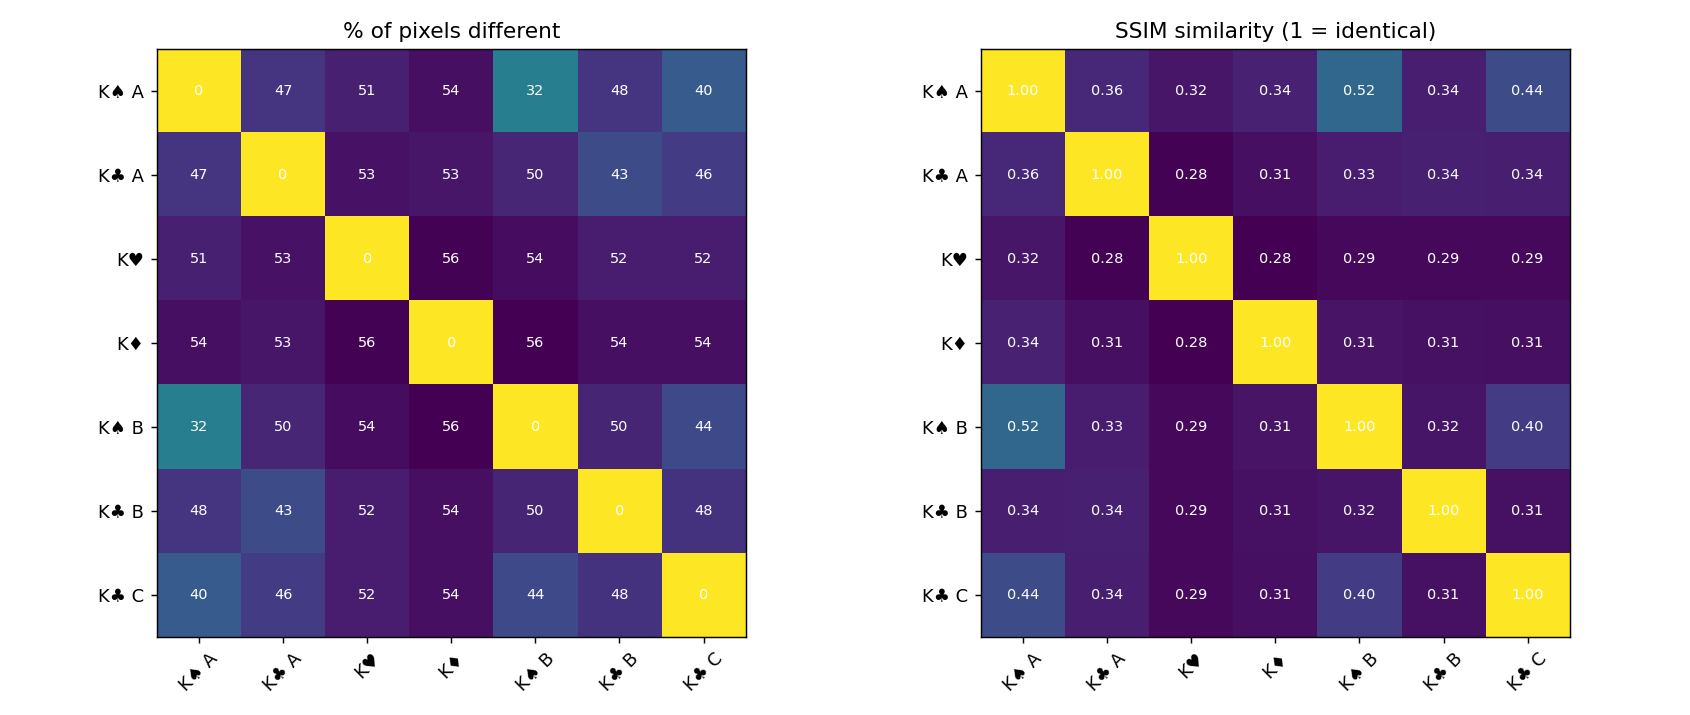
Each square compares two cards: find one card’s row and another’s column, and the square where they meet is that pair’s score. The bright yellow diagonal is each card compared with itself, so ignore it.
Left chart: the share of pixels that differ between the two cards. Lower means more alike.
Right chart: a 0 to 1 similarity score. Higher means more alike.
Colors: brighter teal-green means more alike, and dark purple means very different. Most pairs are dark, meaning roughly half of each card differs.
For reference here are the labels that Claude attached to the cards:
Most similar pairs
| Pair | % of pixels different | SSIM |
|---|---|---|
| K♠ A vs K♠ B | 32% | 0.52 |
| K♠ A vs K♣ C | 40% | 0.44 |
| K♣ A vs K♣ B | 43% | 0.34 |
Most different pairs
| Pair | % of pixels different | SSIM |
|---|---|---|
| K♦ vs K♠ B | 56% | 0.31 |
| K♦ vs K♥ | 56% | 0.28 |
| K♥ vs K♠ B | 54% | 0.29 |
From this basic analysis we learned:
Most distinct: The diamond king differs most from the rest, at about 54% on average. The heart king is next at about 53%.
Most typical: The top spade (K♠ A) is closest to the others on average, at about 45%.
Same-suit pairs: The two spades are the closest pair overall. K♣ C matches the other clubs least because of its stylized design, thus K♣ A and K♣ B (the two traditional clubs) are the closer match.
There are several caveats worth noting about these comparisons. A pixel comparison picks up large layout features, such as the big corner index on both spades or the full-bleed artwork on the diamond, more than the artistic style of the king. That is why K♠ A and K♠ B rank closest even though their kings are drawn differently. This means that even small formatting differences (including irregular cropping) inflates their difference scores.
Additionally, almost every pair lands between 45% and 56% of difference. Despite the high difference between cards the variability of the comparisons is only about 10 percentage points. This indicates that the larger effect of the layout is drowning out the effect of smaller differences.
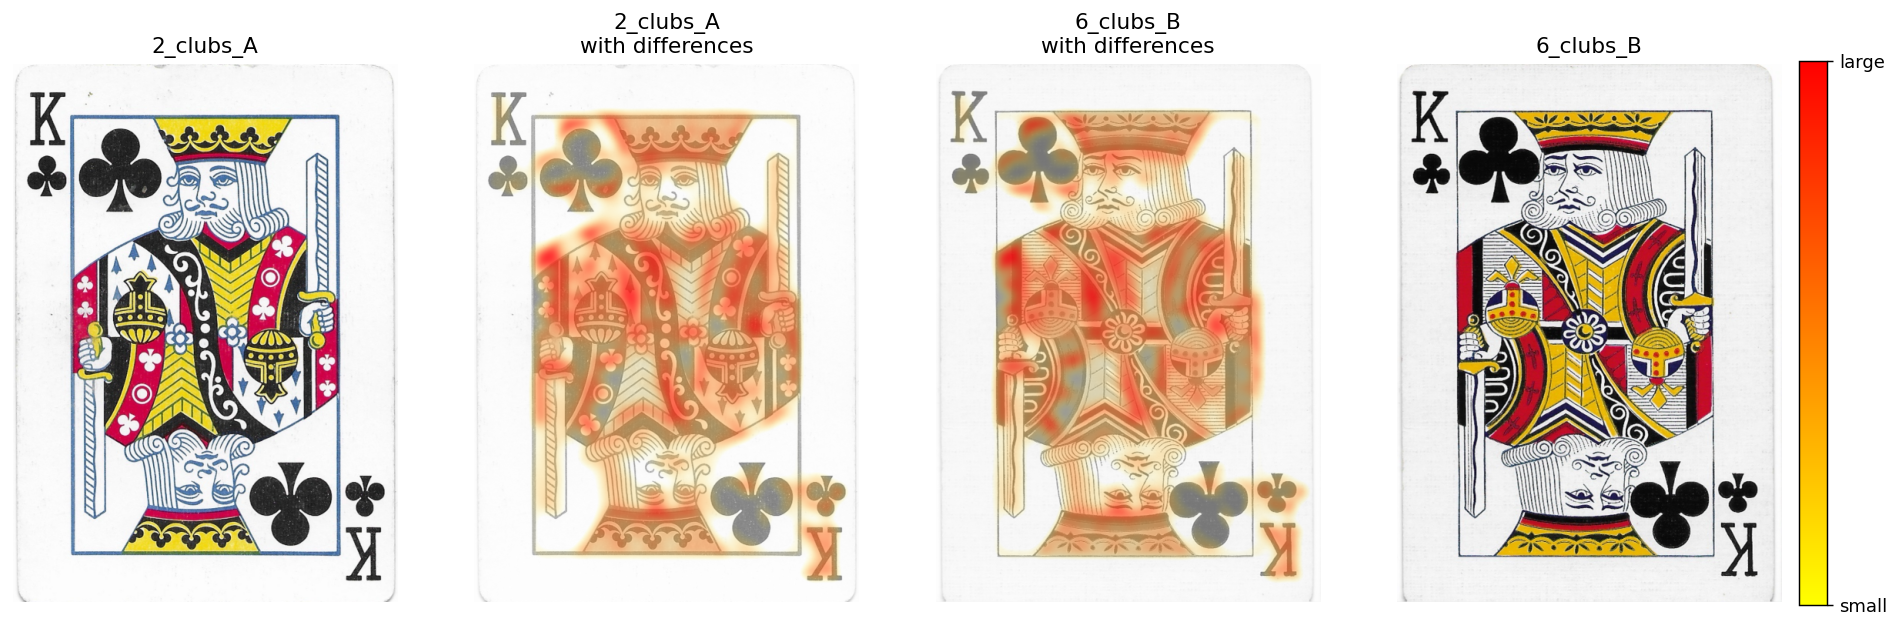
How to read this:
The outer two panels are the original cards.
The middle two panels show each card faded slightly with the heat map painted over it.
Red marks big differences, orange and yellow moderate ones, and no color means the cards look about the same there.
The faintest differences are hidden on purpose so the picture isn’t a muddy wash of color.
As you can see this kind of comparison works best for cards with similar layouts. If the artwork sits in different places on the two cards, the heat map would light up the whole picture.
The Second Attempt
When at first you don’t succeed, continue prompting the AI and try again!
I kindly let Claude know that we needed to align our kings before we could compute new comparison scores for our playing cards.
Which took a bit of troubleshooting, but eventually I hit something close to bullseye.
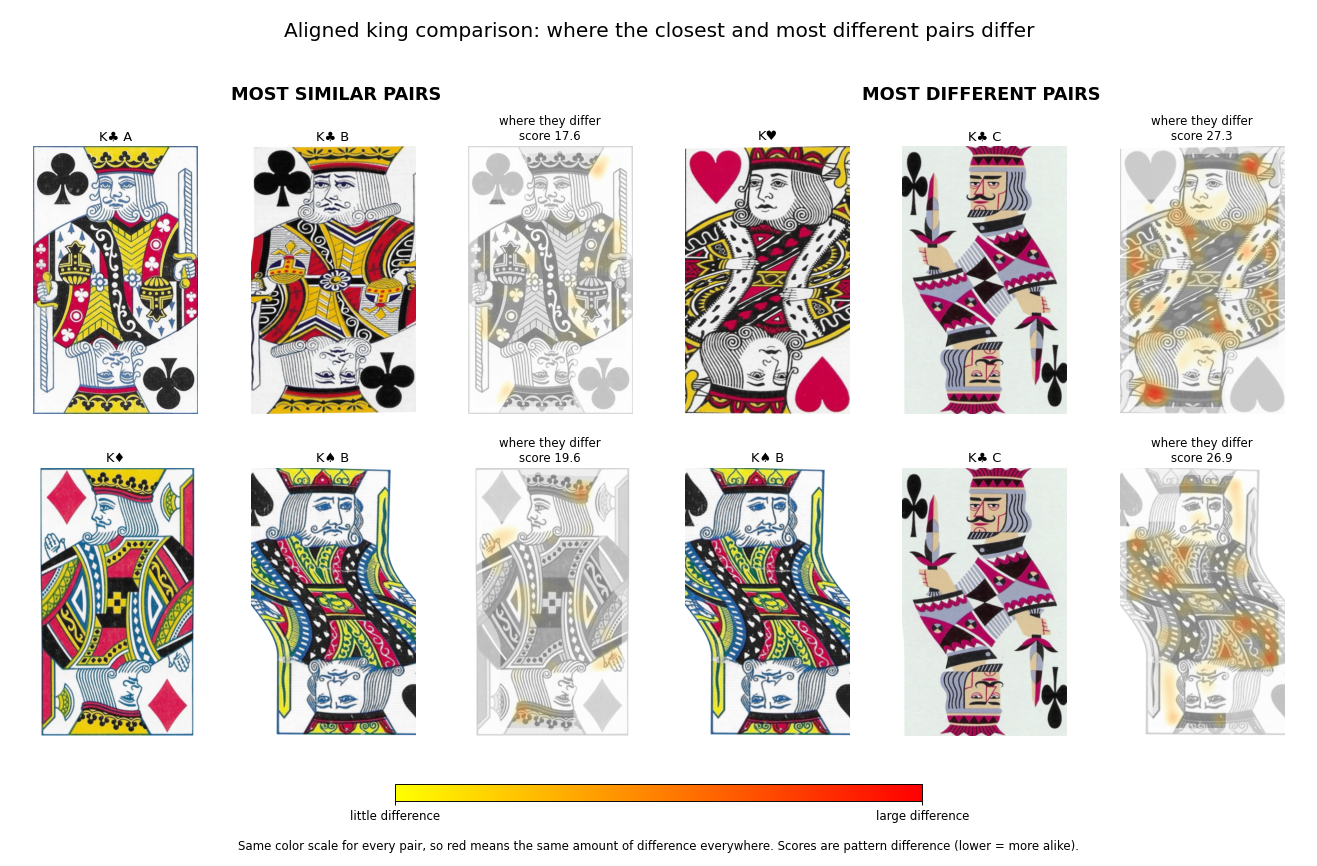
The new analysis crops each card to the king’s framed artwork, warps one king onto the other while aligning them on their eyes and the base of their crowns. This means we are ignoring any formatting differences on the card labels, but who cares about them anyway! We are here for the artwork.
These landmarks creates 6 points for each card:
The outer edge of the upright king’s crown.
Both eyes of the upright king.
Both eyes of the upside-down king.
The outer edge of the upside-down king’s crown.
This alignment is still not perfect but it’s definitely better than what we were working with initially.
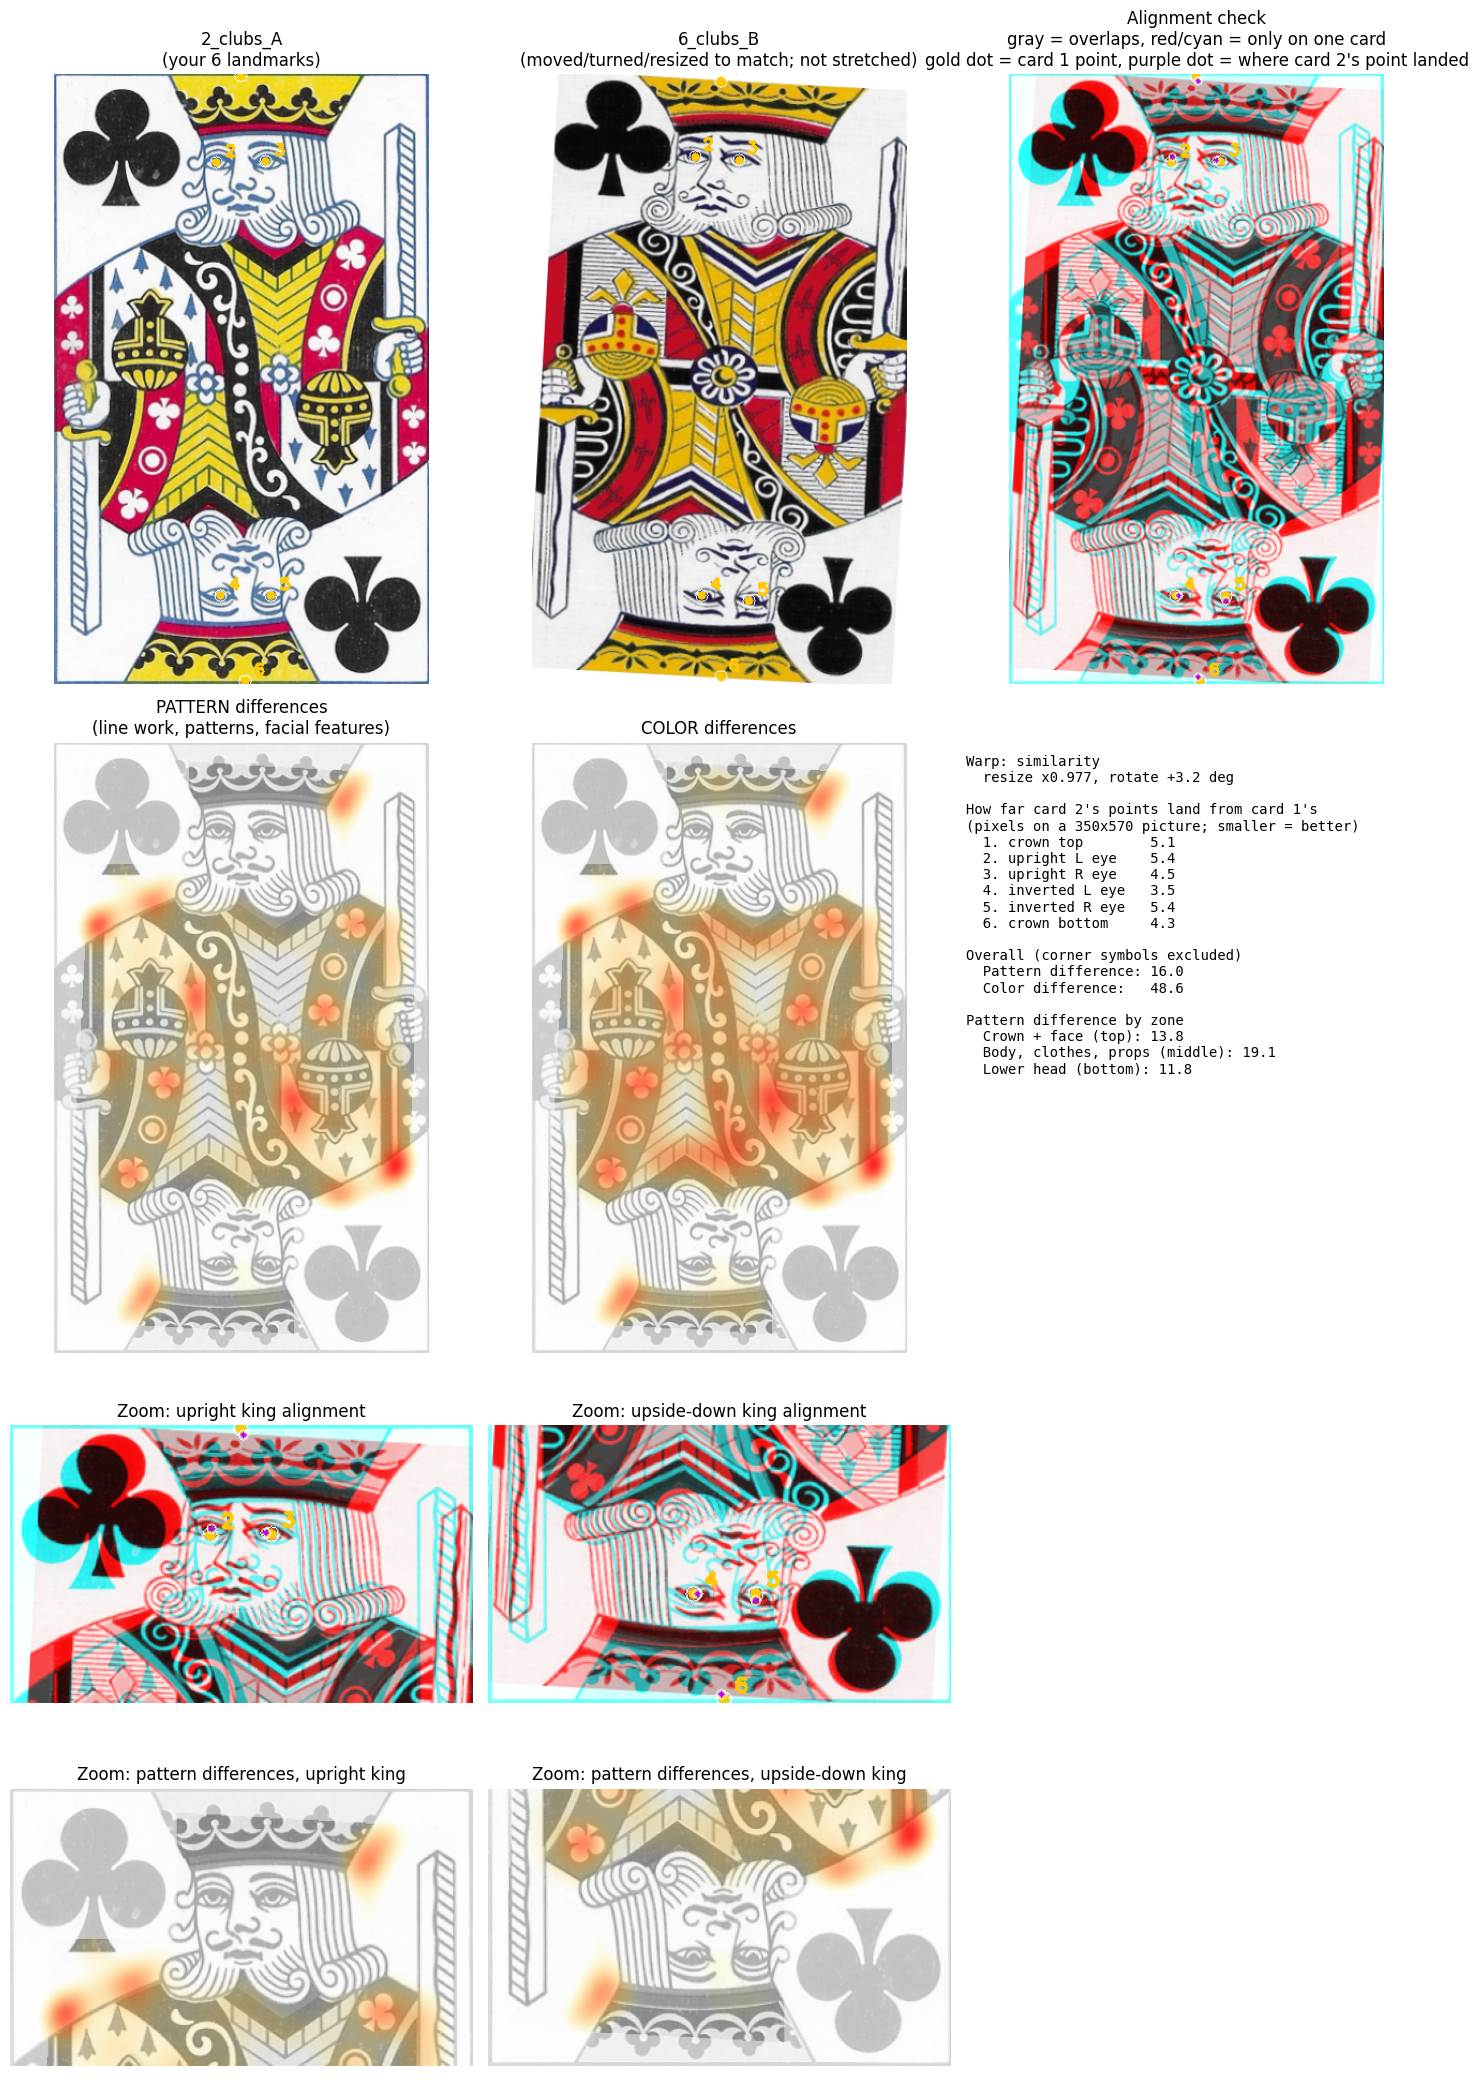
At this point I got completely sidetracked with these awesome heat maps and overlays and asked Claude to create a new and unique card composite! (based on the top right image in the picture above)
But eventually, and after wasting only half an afternoon, we have the final results!
Closest pairs after alignment
| Pair | Pattern difference | Crown + face difference |
|---|---|---|
| K♣ A vs K♣ B | 17.6 | 15.5 |
| K♣ A vs K♦ | 19.6 | 16.9 |
| K♦ vs K♠ B | 19.6 | 20.5 |
| K♦ vs K♣ B | 19.8 | 19.3 |
| K♠ A vs K♠ B | 20.3 | 20.1 |
Most different pairs after alignment
| Pair | Pattern difference | Crown + face difference |
|---|---|---|
| K♥ vs K♣ C | 27.3 | 26.6 |
| K♠ B vs K♣ C | 26.9 | 26.2 |
| K♣ B vs K♣ C | 26.5 | 24.1 |
| K♥ vs K♠ A | 25.6 | 25.4 |
| K♥ vs K♣ A | 25.3 | 23.5 |
Overall range: All 21 pairs fall between 17.6 and 27.3, with an average of 23.
Pairs that rose to the top: The two traditional clubs are now the closest pair, and the diamonds king is surprisingly close to several others. The two spade kings stopped being the standout, which means their earlier closeness was mostly a layout effect.
Outliers: In line with my own observations (and probably yours) the stylized king of clubs (K♣ C) is the most different from the others, and the king of hearts (K♥) is close behind it.
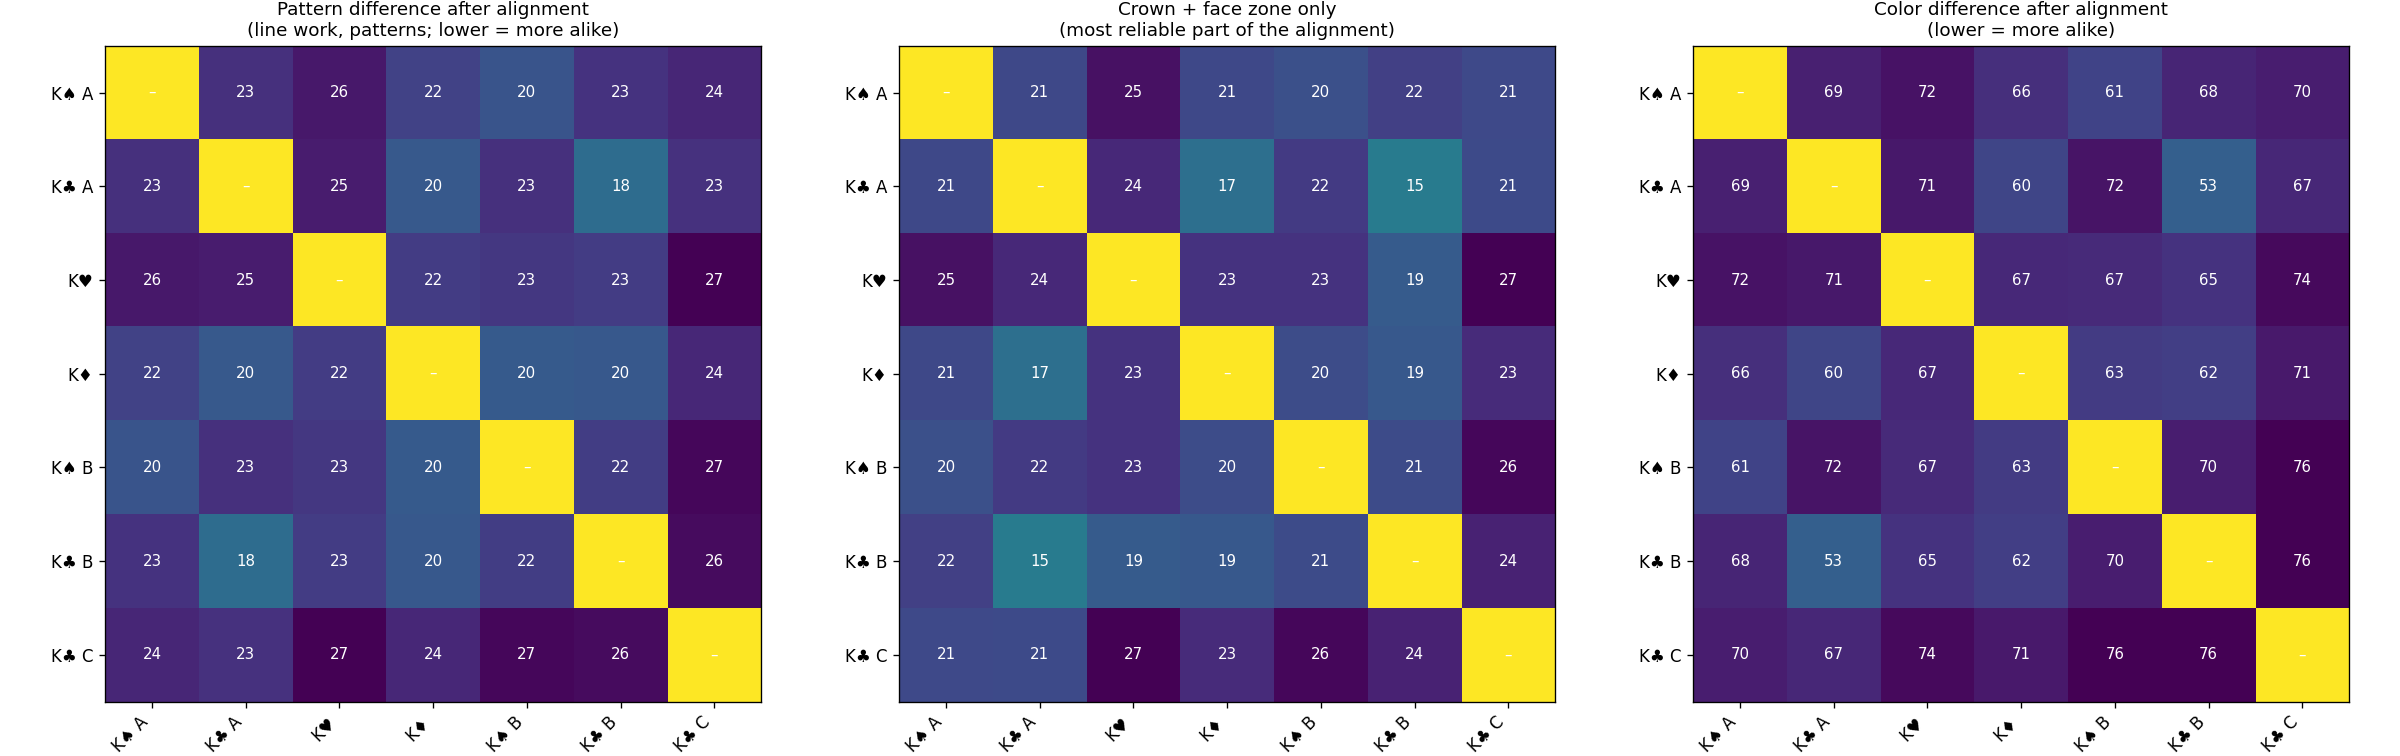
What the scores mean
To test how much of these numbers is just alignment error, I had Claude compare each card to a copy of itself shifted by a few pixels. A 3 px shift scores about 7 and a 5 px shift about 10. This means that the 6 landmark points we placed are good to roughly 5 px, so a noise floor of about 7 to 10 is built into every score. (Thats a bit high, but I wasn’t willing to spend more time on this.)
What this tells you: The real differences (17 to 27) sit clearly above that floor. A gap of a couple of points between two pairs, such as 19.6 against 20.3, is within noise and shouldn’t be ranked.
Robe distortion: Cards with faces placed differently get their robes bent a bit during alignment, so the body scores are less trustworthy than the face scores.
What did we learn from this? Something fun I hope!
But in general, this was a fun exercise in curiosity.